Annotating spatial data (mouse organogenesis)#
Annotate spatial data (seqFISH) of mouse organogenesis [LGM+22] with a restriced set of genes (351), demonstrating CellAnnotator’s performance in this challenging regime of few features.
In this notebook, we’ll use a Gemeni model to demonstrate CellAnnotator’s generic LLM backend, supporting multiple providers and models. Running this notebook will automatically download the data from figshare.
Preliminaries#
Import packages & data#
%load_ext autoreload
%autoreload 2
import scanpy as sc
import matplotlib.pyplot as plt
import seaborn as sns
import squidpy as sq
import warnings

from cell_annotator import CellAnnotator, ObsBeautifier
from cell_annotator.utils import _shuffle_cluster_key_categories_within_sample
sc.set_figure_params(scanpy=True, frameon=False, fontsize=12)
Load spatial data of mouse organogenesis at embryonic day (E) 8.5 [LGM+22].
adata = sc.read("data/spatial_data.h5ad", backup_url="https://figshare.com/ndownloader/files/54145250")
adata
AnnData object with n_obs × n_vars = 51787 × 351
    obs: 'embryo', 'pos', 'z', 'embryo_pos', 'embryo_pos_z', 'Area', 'celltype_seqfish', 'sample_seqfish', 'umap_density_sample', 'modality', 'total_counts', 'n_counts', 'celltype_harmonized'
    uns: 'celltype_harmonized_colors', 'celltype_seqfish_colors', 'embryo_colors', 'pca', 'umap'
    obsm: 'X_pca', 'X_umap', 'X_umap_orig', 'spatial'
    varm: 'PCs'
Preprocess the data#
Create numerical cell type labels to be used for annotation and a shuffled version thereof.
Wwe’ll use the available batch information to denote samples. We’ll randomly shuffled the order of cluster labels within each sample to resemble a realistic scenario, in which we’re given a dataset with several samples, with independent clustering per sample (i.e., pre-integration).
adata.obs["leiden"] = adata.obs["celltype_harmonized"].copy()
adata.obs["leiden"] = adata.obs["leiden"].cat.rename_categories(
    {cat: str(i) for i, cat in enumerate(adata.obs["leiden"].cat.categories)}
)

adata = _shuffle_cluster_key_categories_within_sample(adata, sample_key="embryo", key_added="leiden_shuffled")
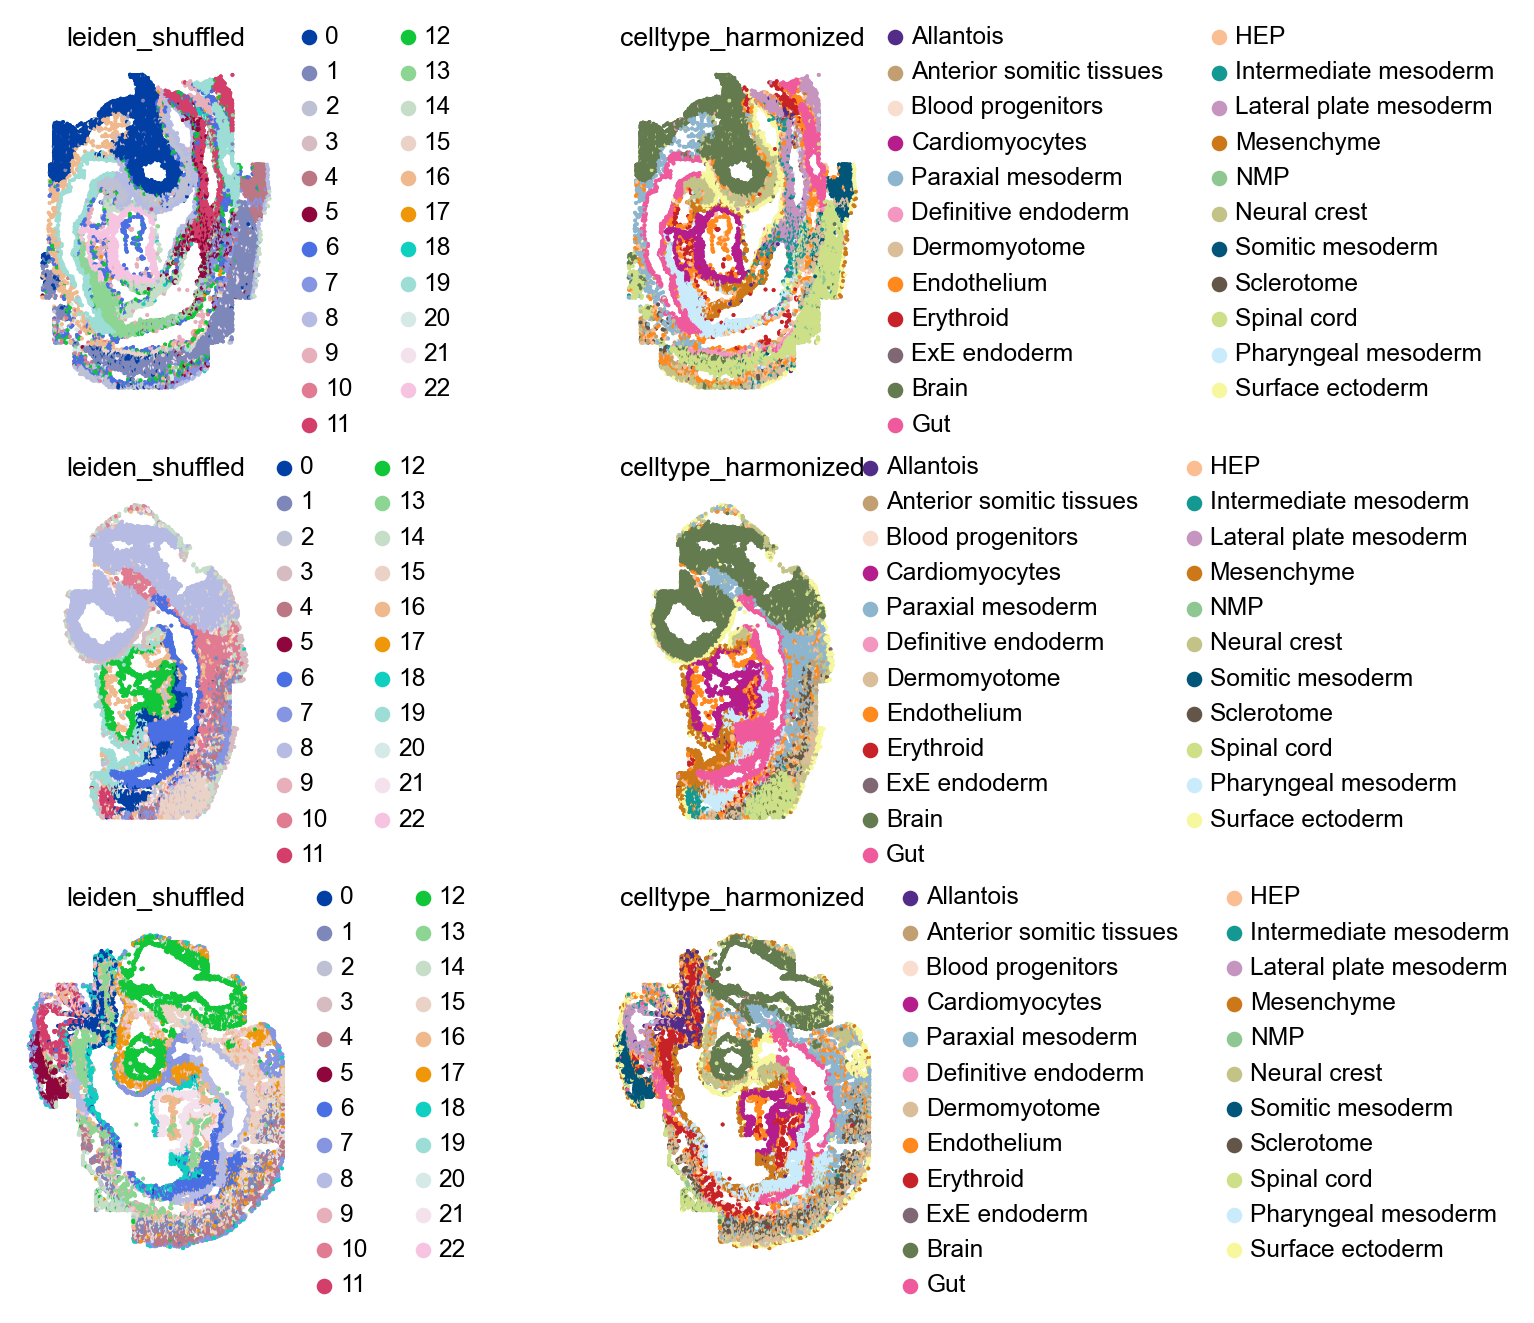
Visualize
with warnings.catch_warnings():
    warnings.simplefilter("ignore")

    sq.pl.spatial_scatter(
        adata,
        color=[
            "leiden_shuffled",
            "celltype_harmonized",
        ],
        library_key="embryo",
        shape=None,
        ncols=2,
        figsize=(4, 3),
        wspace=0.1,
    )
Let’s also do some basic pre-processing of the counts.
sc.pp.normalize_total(adata, target_sum=1e4)
sc.pp.log1p(adata)
Query cell type labels per sample#
ca_sp = CellAnnotator(
    adata,
    species="mouse",
    tissue="everything/organogenesis",
    stage="embryonic day 8.5",
    cluster_key="leiden_shuffled",
    sample_key="embryo",
    model="gemini-2.5-flash",
)
ca_sp
INFO     ✅ GEMINI API key is available
INFO     Initializing `3` SampleAnnotator objects(s).
🧬 CellAnnotator
================
📋 Species: mouse
🔬 Tissue: everything/organogenesis
⏳ Stage: embryonic day 8.5
🔗 Cluster key: leiden_shuffled
🔬 Sample key: embryo

🤖 Provider: gemini
🧠 Model: gemini-2.5-flash

🔋 Status: ❌ Not working

📊 Samples: 3
🏷️  Sample IDs: 'embryo1', 'embryo2', 'embryo3'
Let’s first query expected cell types and marker genes in this system.
ca_sp.get_expected_cell_type_markers()
INFO     Querying cell types.
INFO     Writing expected cell types to `self.expected_cell_types`
INFO     Querying cell type markers.
INFO     Writing expected marker genes to `self.expected_marker_genes`.
INFO     Filtering marker genes to only include those present in adata.var_names.
With that, we can run the annotation workflow.
ca_sp.get_cluster_markers(min_auc=0.6, min_specificity=0.6)
INFO     Iterating over samples to compute cluster marker genes.
WARNING  Not enough cells for cluster 17 in sample `embryo2` (1<3).
ca_sp.annotate_clusters()
INFO     Iterating over samples to annotate clusters.
WARNING  Not enough markers provided for cluster 3 in sample `embryo1` (1<2).
WARNING  Not enough markers provided for cluster 10 in sample `embryo3` (0<2).
INFO     Querying cell-type label de-duplication.
INFO     Removed 6/25 cell types.
INFO     Iterating over samples to harmonize cell type annotations.
INFO     Writing updated cluster labels to `adata.obs[`cell_type_predicted'].
🧬 CellAnnotator
================
📋 Species: mouse
🔬 Tissue: everything/organogenesis
⏳ Stage: embryonic day 8.5
🔗 Cluster key: leiden_shuffled
🔬 Sample key: embryo

🤖 Provider: gemini
🧠 Model: gemini-2.5-flash

🔋 Status: ❌ Not working

📊 Samples: 3
🏷️  Sample IDs: 'embryo1', 'embryo2', 'embryo3'
Evaluate results#
obr = ObsBeautifier(adata, model="o4-mini")  # reasoning models work best here

# bring categories into a more meaningful order
obr.reorder_categories(keys=["celltype_harmonized", "cell_type_predicted"])

# assign colors to the categories
obr.assign_colors(keys=["celltype_harmonized", "cell_type_predicted"])
INFO     ✅ OPENAI API key is available
INFO     Querying label ordering.
INFO     Reordering categories for key 'celltype_harmonized'
INFO     Reordering categories for key 'cell_type_predicted'
INFO     Querying cluster colors.
INFO     Assigning colors for key 'celltype_harmonized'
INFO     Assigning colors for key 'cell_type_predicted'
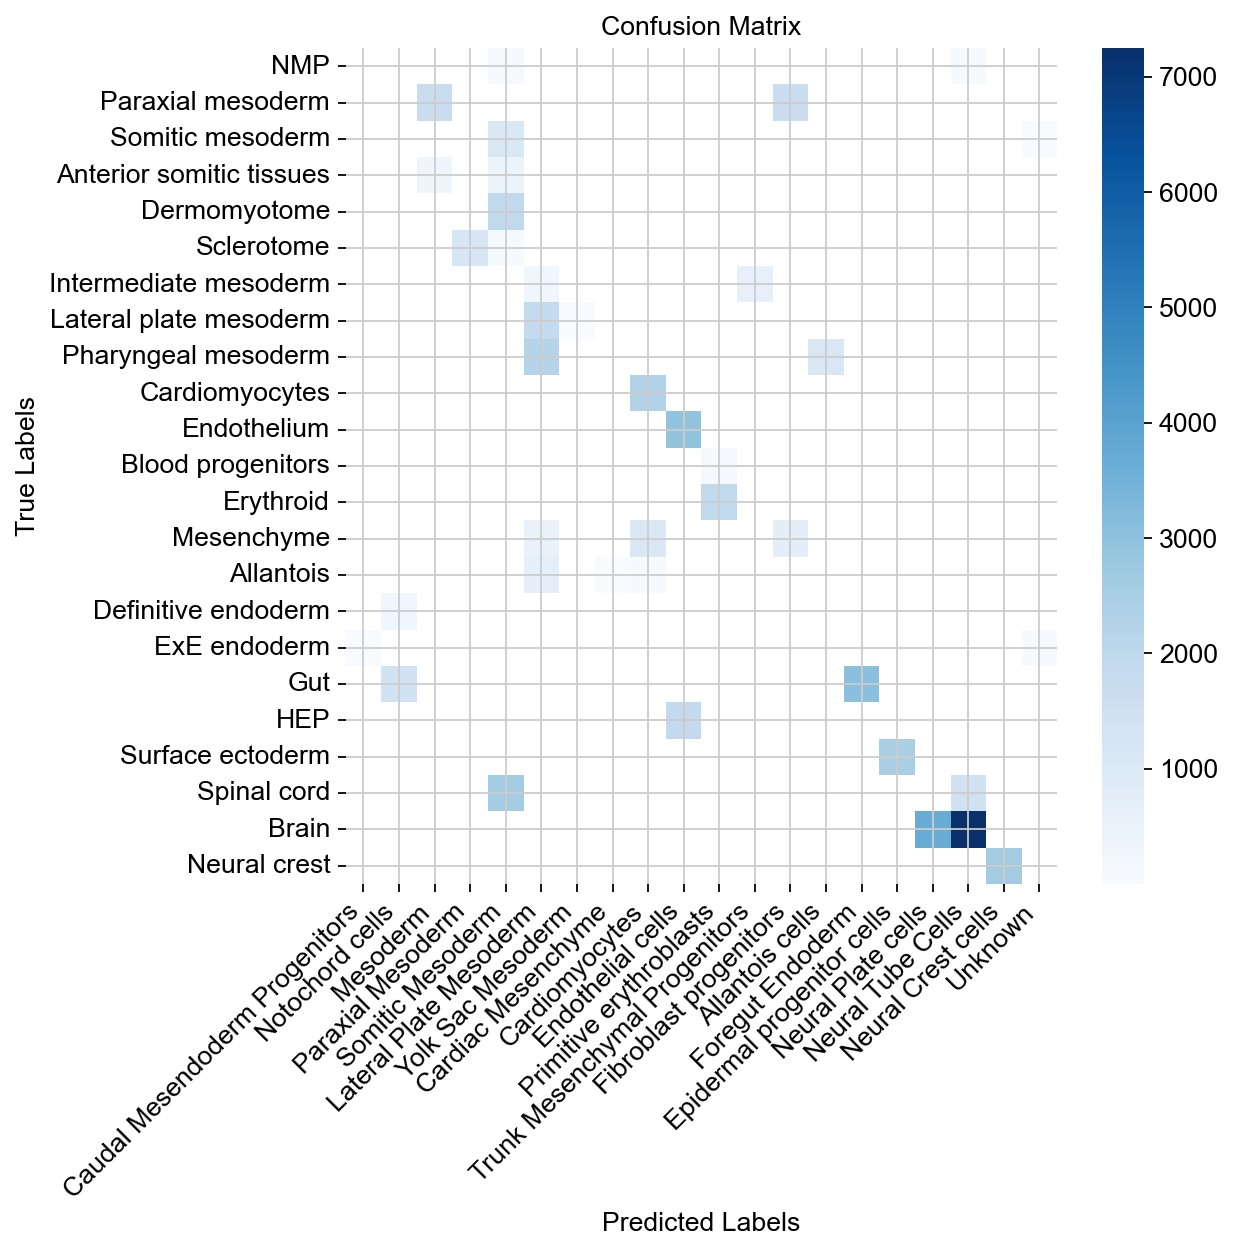
Compute ground-truth with predicted cell type labels in a confusion matrix (across all samples).
df = adata.obs.groupby(["celltype_harmonized", "cell_type_predicted"], observed=True).size().unstack()

# Plot the heatmap
plt.figure(figsize=(8, 8))
sns.heatmap(df, annot=False, cmap="Blues", xticklabels=True, yticklabels=True)
plt.title("Confusion Matrix")
plt.xlabel("Predicted Labels")
plt.ylabel("True Labels")
plt.xticks(rotation=45, ha="right")
plt.yticks(rotation=0)
plt.tight_layout()
plt.show()
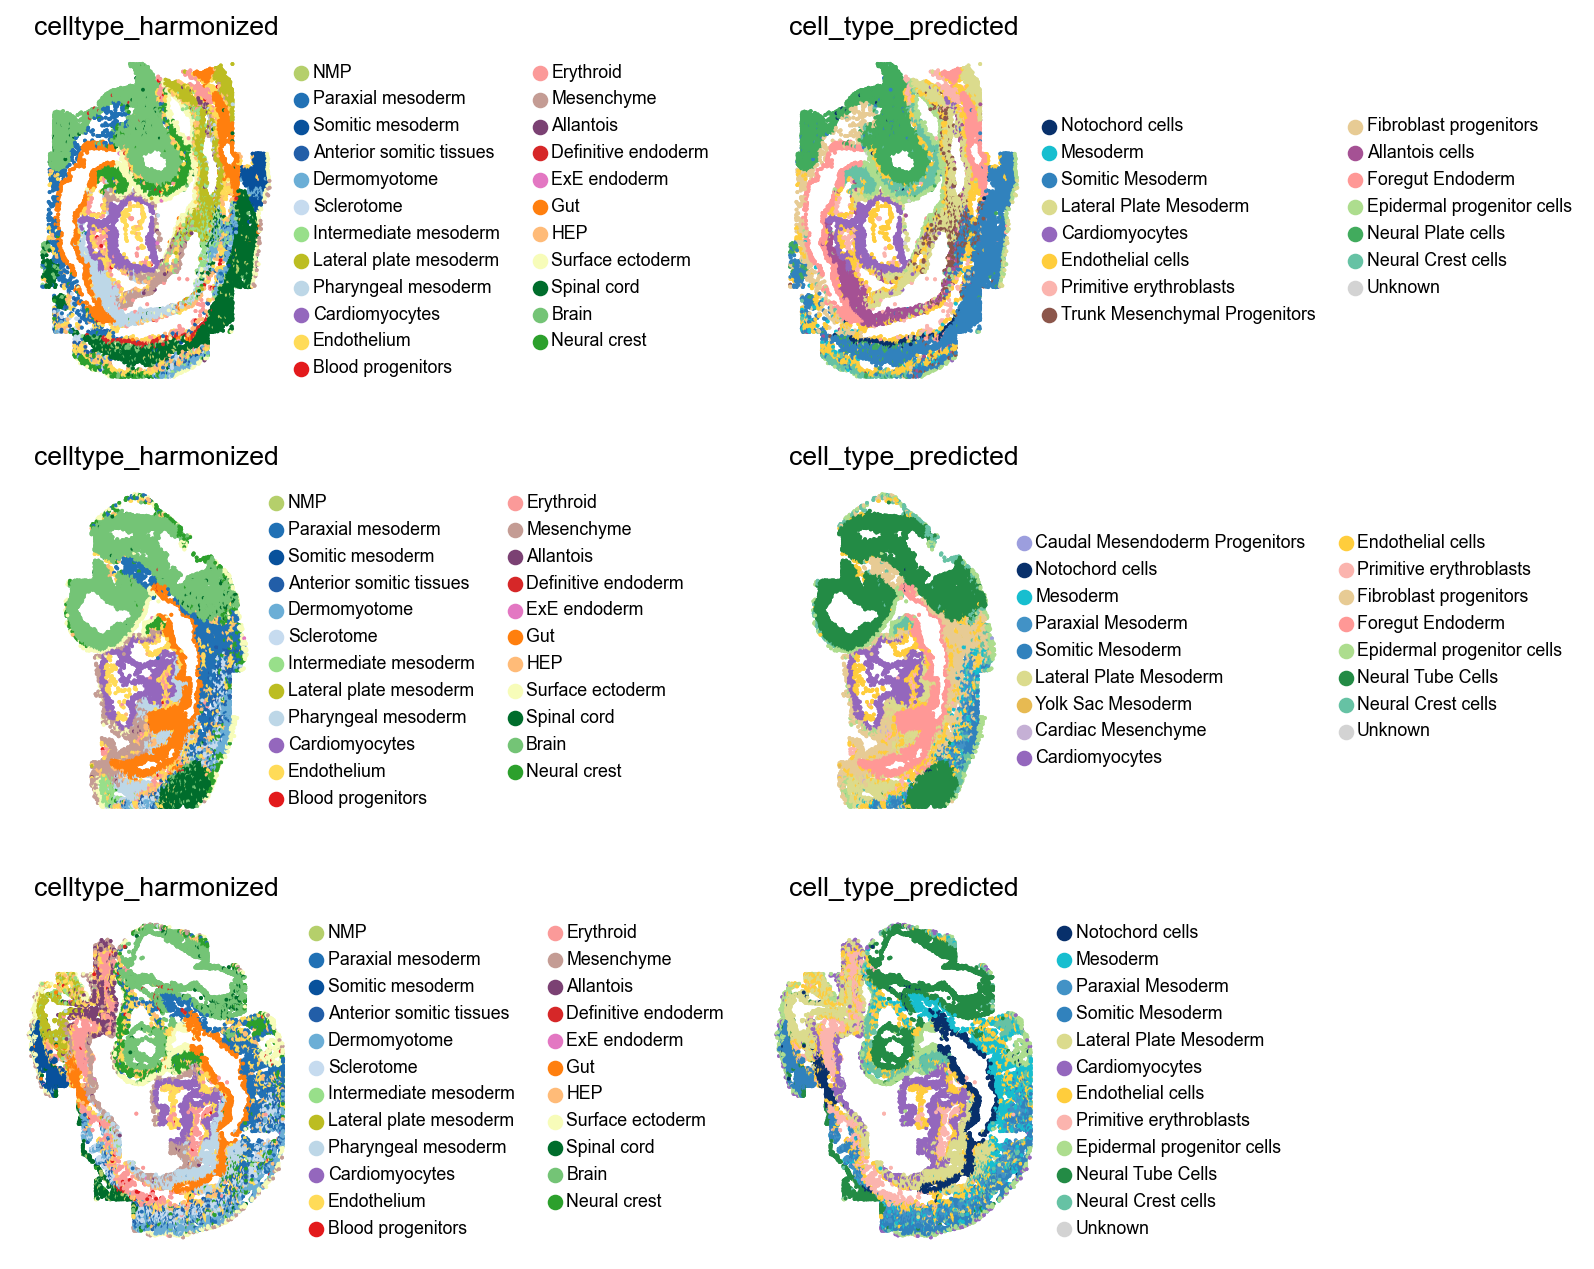
We can also inspect results in spatial coordinates. Note that we changed the colors of the original annotations to easy comparisons with the predictions.
with warnings.catch_warnings():
    warnings.simplefilter("ignore")

    with plt.rc_context({"legend.fontsize": 8}):
        sq.pl.spatial_scatter(
            adata,
            color=[
                "celltype_harmonized",
                "cell_type_predicted",
            ],
            library_key="embryo",
            shape=None,
            ncols=2,
            wspace=0.3,
            figsize=(4, 3),
        )